


Example 8: Vessel Segmentation using SoVascularSystem

Introduction
In this tutorial, we are using an input mask to create a vessel centerline using the DtfSkeletonization module and visualize the vascular structures in 3D using the SoVascularSystem module. The second part uses the distance between centerline and surface of the vessel structures to color thin vessels red and thick vessels green.
Steps to Do
Develop Your Network
Load the example tree mask by using the LocalImage module. Connect the output to a DtfSkeletonization module as seen below. The initial output of the DtfSkeletonization module is empty. Press the Update button to calculate the skeleton and the erosion distances.

Below you can see the output of the original image taken from the LocalImage module (left) compared to the output after calculating the skeleton via DtfSkeletonization module (right).

The output DtfSkeletonization.outBase1 shows nothing. Here you can find the three-dimensional graph of the vascular structures. To generate it, open the panel of the DtfSkeletonization module, set Update Mode to Auto Update, and select Update skeleton graph. Now the output additionally provides a 3D graph. Additionally, enable the Compile Graph Voxels to provide all object voxels at the output.

You can use the Output Inspector to see the 3D graph.

If you want to visualize your graph, you should connect a GraphToVolume module to the DtfSkeletonization module. The result is a 2D or 3D volume of your graph that you can connect to any 2D or 3D viewer. Add a View2D and a View3D module to the GraphToVolume module and update the volume.

For coloring the vessels depending on their distances to the centerline, we need a SoLUTEditor module. Change your network to use a SoExaminerViewer module, a SoLUTEditor module and a SoBackground module instead of a View3D module.
Use the SoLUTEditor for the View2D, too.

Open the output of the GraphToVolume module and inspect the images in Output Inspector. You will see that the voxel value of the black background is defined as -1 while the vessel tree is defined as 0.

Open the Panel of the SoLUTEditor and select tab Range. Define New Range Min as -1 and New Range Max as 0.

Change to Editor tab and define the following LUT:

The viewers now show your vessel graph.

Store Edge IDs in Skeletons With RunPythonScript
Each edge of the calculated skeleton gets a unique ID defined by the DtfSkeletonization module. We now want to use this ID to define a different color for each edge of the skeleton. You can use the Label property of each skeleton to store the ID of the edge.
Add a RunPythonScript module to your network, open the panel of the module and enter the following Python code:
ctx.field("DtfSkeletonization.update").touch()

graph = ctx.field("DtfSkeletonization.outBase1").object()
if graph is not None:
  for edge in graph.getEdges():
    print(edge.getId())

ctx.field("GraphToVolume.update").touch()
First, we always want a fresh skeleton. We touch the update trigger of the module DtfSkeletonization. Then, we get the graph from the DtfSkeletonization.outBase1 output. If a valid graph is available, we walk through all edges of the graph and print the ID of each edge. In the end, we update the GraphToVolume module to get the calculated values of the Python script in the viewers. Click Execute.
The Debug Output of the MeVisLab IDE shows a numbered list of edge IDs from 1 to 153.

We now want the edge ID to be used for coloring each of the skeletons differently. Open the Panel of the SoLUTEditor and select tab Range. Define New Range Min as 0 and New Range Max as 153. Define different colors for your LUT.

The SoGVRVolumeRenderer module also needs a different setting. Open its panel in the Main tab, select Illuminated as the Render Mode. Adjust the Quality setting to 0.10. On tab Advanced, set Filter Volume Data to Nearest. Change to the Illumination tab and define below parameters:


Change your Python script as follows:
ctx.field("DtfSkeletonization.update").touch()

graph = ctx.field("DtfSkeletonization.outBase1").object()
if graph is not None:
  label = "Label"
  for edge in graph.getEdges():
    for skeleton in edge.getSkeletons():
      if label not in skeleton.properties:
        skeleton.createPropertyDouble(label, edge.getId())
      skeleton.setProperty(label, edge.getId())

ctx.field("GraphToVolume.update").touch()
In the case the graph is valid, we now define a static text for the label. Instead of printing the edge ID, we also walk through each skeleton of the edge and define the property for the label using the ID of the edge as value.
Your viewers now show a different color for each skeleton, based on our LUT.

Render the Vascular System Using SoVascularSystem
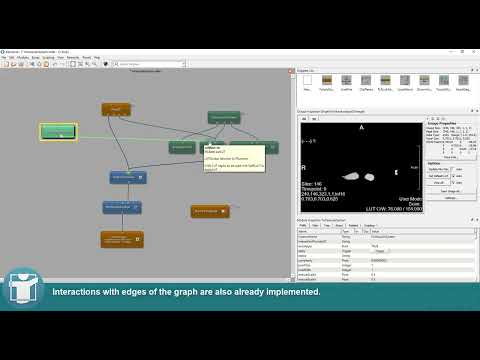
The SoVascularSystem module is optimized for rendering vascular structures. In comparison to the SoGVRVolumeRenderer module, it allows to render the surface, the skeleton or points of the structure in an open inventor scene graph. Interactions with edges of the graph are also already implemented.
Add a SoVascularSystem module to your workspace. Connect it to your DtfSkeletonization module and to the SoLUTEditor as seen below. Add another SoExaminerViewer for comparing the two visualization. The same SoBackground can be added to your new scene.
Uncheck Use skeleton colors and Use integer LUT on Appearance tab of the SoVascularSystem module panel.

More information about the SoVascularSystem module can be found in the
help page
of the module.
Draw parameter connections from one SoExaminerViewer to the other. Use the fields seen below to synchronize your camera interaction.

Connect the backwards direction of the two SoExaminerViewer by using multiple SyncFloat modules and two SyncVector modules for
SyncFloat module. For fields containing vector, the appropriate connection can be achieved using the SyncVector module.
Camera interactions are now synchronized between both SoExaminerViewer modules.
Now, you can notice the difference between the two modules. We use SoVascularSystem for a smoother visualization of the vascular structures by using the graph as reference. The SoGVRVolumeRenderer renders the volume from the GraphToVolume module, including the visible stairs from voxel representations in the volume.

The SoVascularSystem module has additional visualization examples unlike SoGVRVolumeRenderer. Open the panel of the SoVascularSystem module and select Random Points for

Change it to Skeleton to only show the centerlines/skeletons of the vessels.

GraphToVolume.Enhance Vessel Visualization Based on Distance Information
Now that you’ve successfully obtained the vessel skeleton graph using DtfSkeletonization, let’s take the next step to enhance the vessel visualization based on the radius information of the vessels. We will modify the existing code to use the minimum distance between centerline and surface of the vessels for defining the color.
The values for the provided vascular tree vary between 0mm and 10mm. Therefore, define the range of the SoLUTEditor to

In the RunPythonScript module, change the existing code to the following:
ctx.field("DtfSkeletonization.update").touch()

graph = ctx.field("DtfSkeletonization.outBase1").object()
if graph is not None:
  label = "Label"
  print('Num edges', len(graph.getEdges()))
  for edge in graph.getEdges():
    end_node = edge.getEndNode()
    for skeleton in edge.getSkeletons():
      if label not in skeleton.properties:
        skeleton.createPropertyDouble(label, skeleton.getProperty("MinDistance"))
      skeleton.setProperty(label, skeleton.getProperty("MinDistance"))

ctx.field("GraphToVolume.update").touch()
ctx.field("SoVascularSystem.apply").touch()
DTFSkeletonization is a vascular graph with an idealized, circular profile while in reality, the vessels have more complicated profiles. It is an idealized graph where all vessels have a circular cross section. This cross section only has one radius, described by Instead of using the ID of each edge for the label property, we are now using the

If you have a NIfTI file, convert it into an ML image. Load your tree mask NIfTI file using the itkImageFileReader module. Connect the output to a BoundingBox module, which removes black pixels and creates a volume without unmasked parts. In the end, add a MLImageFormatSave module to save it as .mlimage file. They are much smaller than a NIfTI file.

Mouse Clicks on Vessel Graph
Open the Interaction tab of the SoVascularSystem module. In SoExaminerViewer module, change to Pick Mode and click into your vessel structure. The panel of the SoVascularSystem module shows all information about the hit of your click in the vessel tree.

Summary
- Vessel centerlines can be created using a
DtfSkeletonizationmodule. - Vascular structures can be visualized using a
SoVascularSystemmodule, which provides several vessel-specific display modes. - The
SoVascularSystemmodule provides information about mouse clicks into a vascular tree. - The labels of a skeleton can be used to store additional information for visualization.