Example 1.1: MeVisLab Coordinate Systems
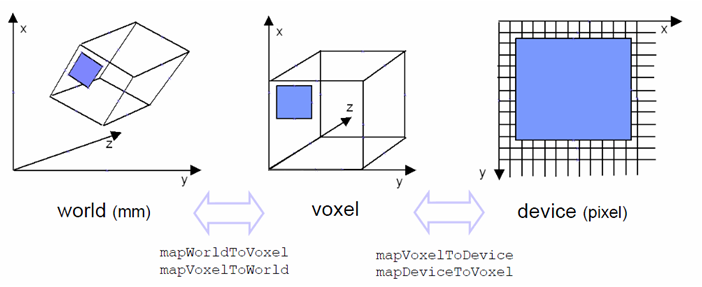
Three coordinate systems exist next to each other:
- World coordinates
- Voxel coordinates
- Device coordinates
World coordinate systems in MeVisLab are always right handed.
The blue rectangle shows the same region in the three coordinate systems.
World coordinates
World coordinates are:
- Global: Combine several objects in a view
- Isotropic: All directions are equivalent
- Orthogonal: Coordinate axes are orthogonal to each other
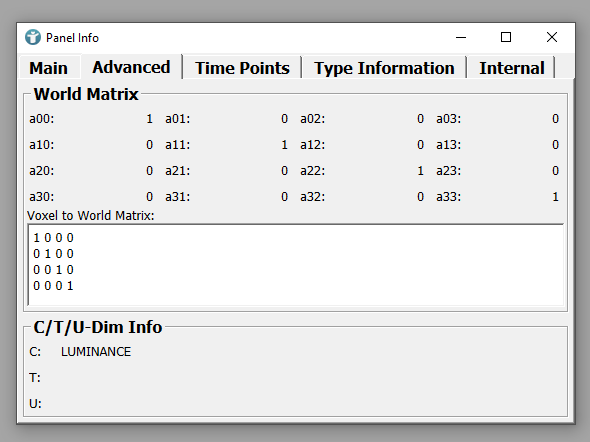
The origin of the world coordinate system can be anywhere and is not clearly defined. Origins of the other coordinate systems can always be mapped to the world coordinate system. In case of DICOM images, this mapping is defined by DICOM tags.
World coordinates in MeVisLab
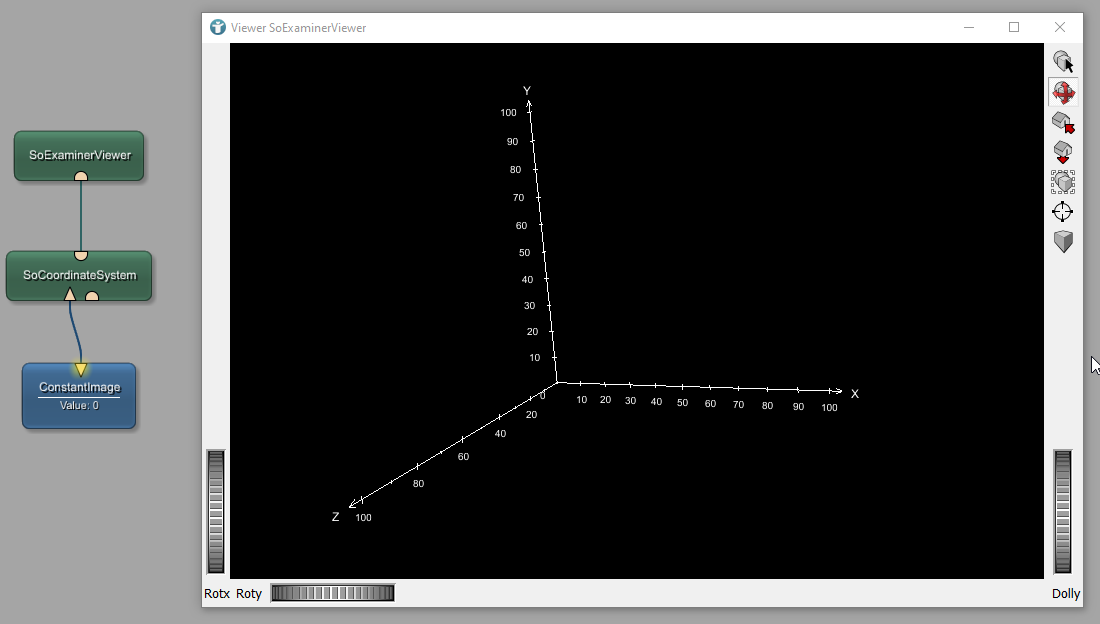
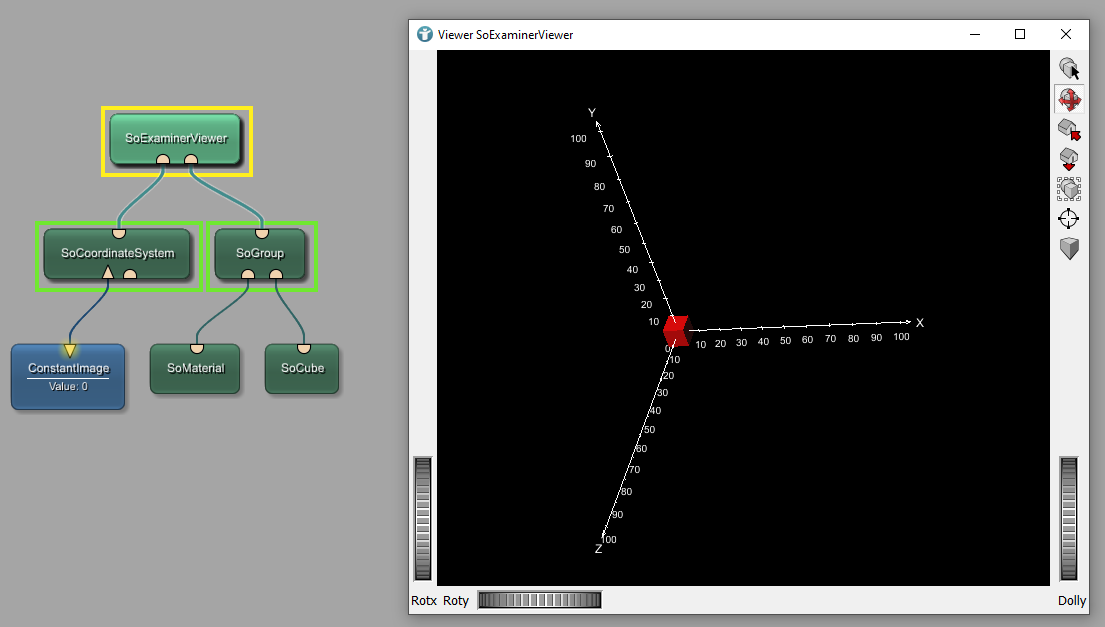
You can show the world coordinates in MeVisLab by using the following example network:
The ConstantImage module generates an artificial image with a certain size, data type and a constant fill value. The origin of the image is at the origin of the world coordinate system, therefore the SoCoordinateSystem module shows the world coordinate system. In order to have a larger z-axis, open the panel of the ConstantImage module and set IMage Size for Z to 256.
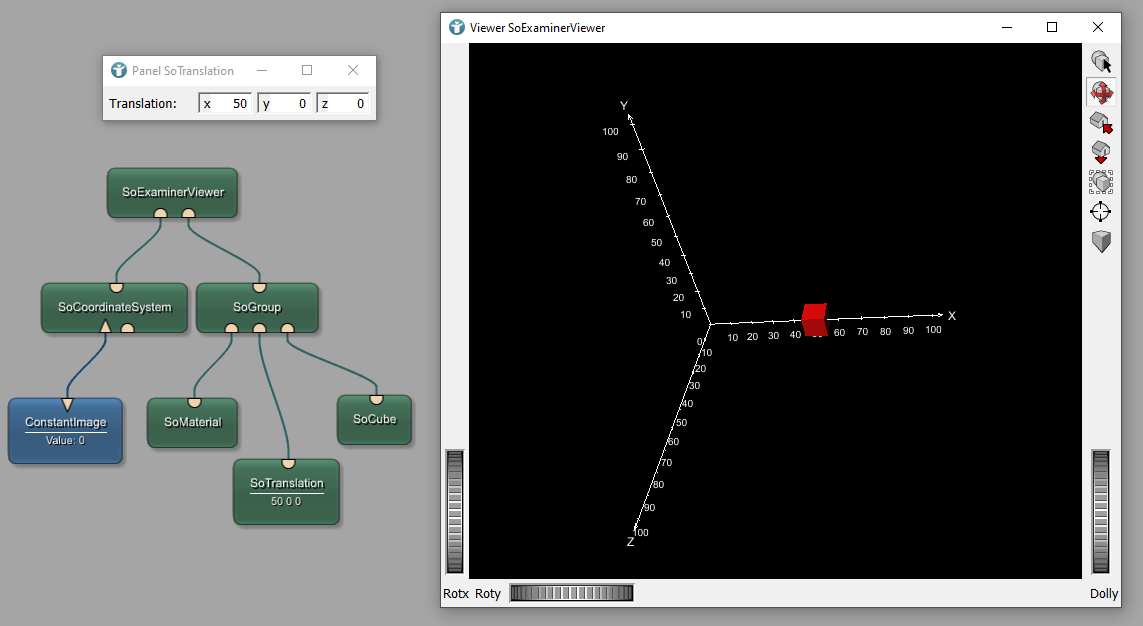
Placing an object into the Open Inventor Scene of the SoExaminerViewer, in this case a SoCube with width, height and depth of 10, places the object to the origin of the world coordinate system.
Translations
You can move an object in your scene, for example by using a SoTranslation module. Update your network and add the module before your cube. Defining a translation vector 50, 0, 0 moves your cube by 50 in x-direction based on the origin of the world coordinate system.
Transformations
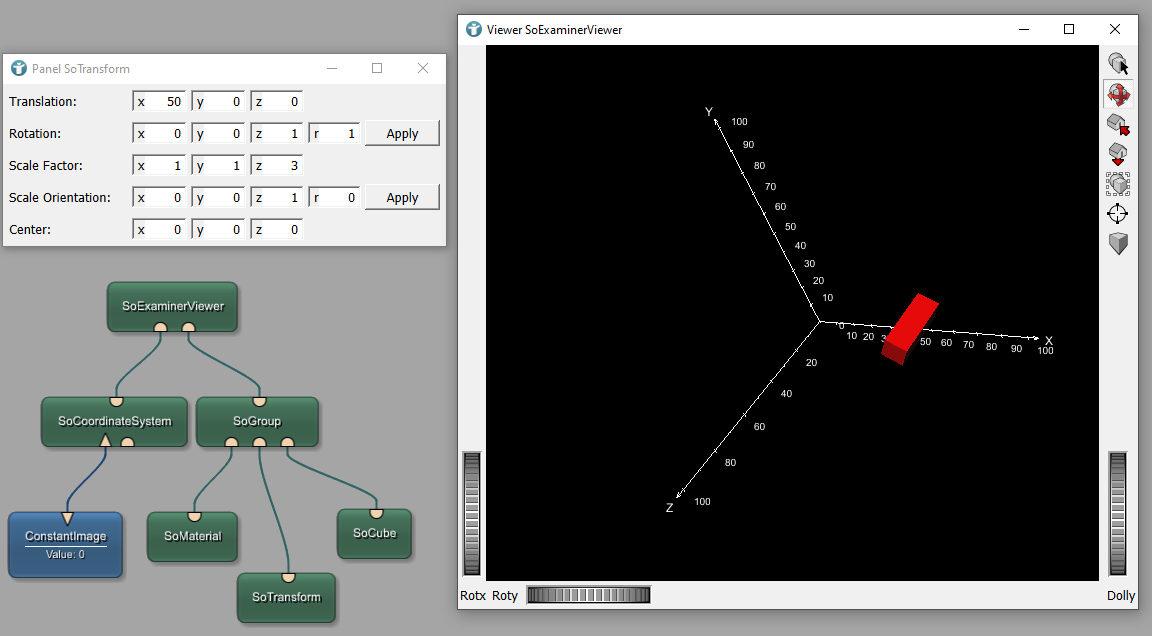
More complex transformations can be done by using the SoTransform module. You can not only translate an existing object, but also rotate, scale and apply many other transformations.
Voxel coordinates
Voxel coordinates are:
- Relative to an image
- Continuous from [0..x,0..y,0..z], voxel center at 0.5
- Direct relation to voxel location in memory
Voxel coordinates in MeVisLab
You can show the voxel coordinates in MeVisLab by using the following example network:
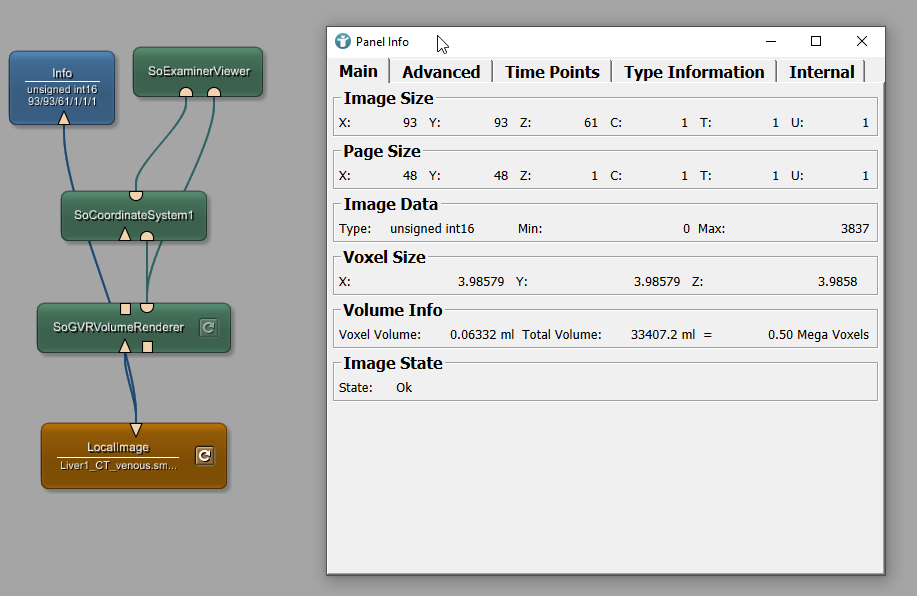
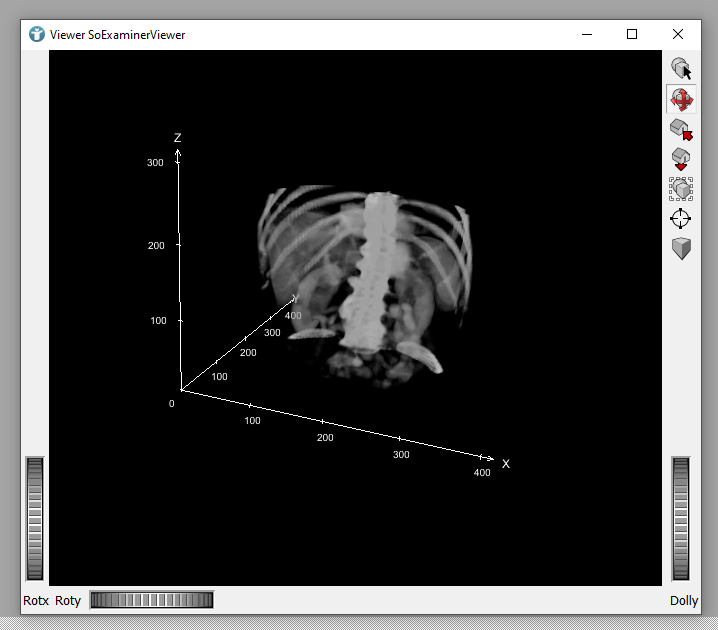
Load the file Liver1_CT_venous.small.tif .The Info module shows detailed information about the image loaded by the LocalImage. Opening the SoExaminerViewer shows the voxel coordinate system of the loaded image. You may have to change the LUT in SoGVRVolumeRenderer so that the image looks better.
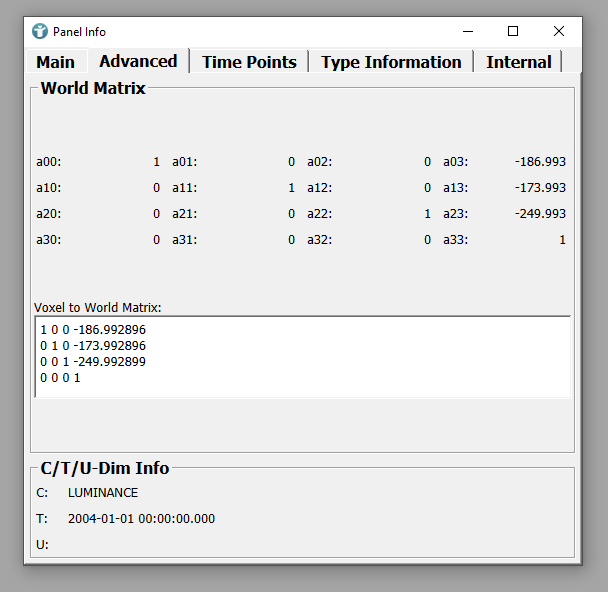
The Advanced tab of the Info module shows the world coordinates of the image. In this case, the origin of the voxel coordinate system is located at -186.993, -173.993, -249.993.
In addition to that, you can see a scaling which has been done on the image. The voxel sizes are shown in the diagonal values of the matrix as 3.985792, 3.985792, 3.985798.
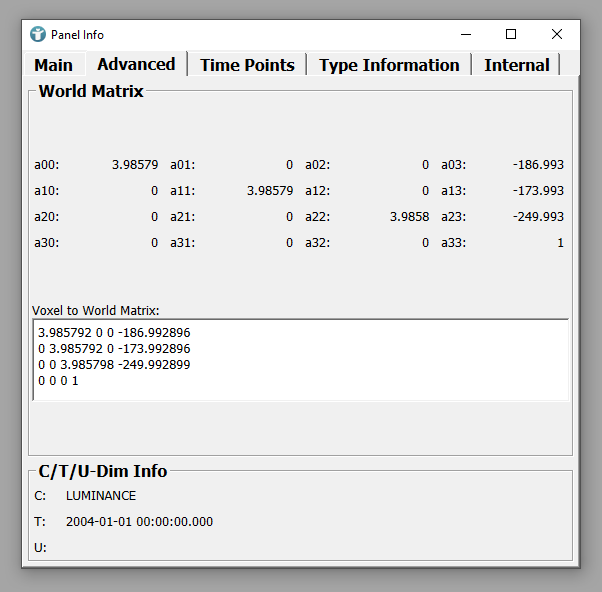
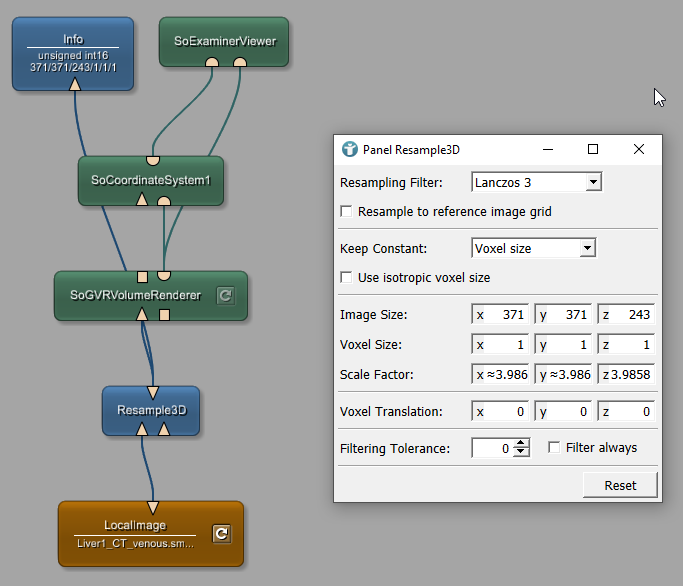
You can change the scaling to 1 by adding a Resample3D module to the network, Set the voxel size to 1, 1, 1 and inspect the Info module.
The voxel size is now 1.
You can add this network to the world coordinate system network developed above and see both coordinate systems.
SoGroup module from the World Group in your network by a SoSeparator. Additional details about the difference can be found here.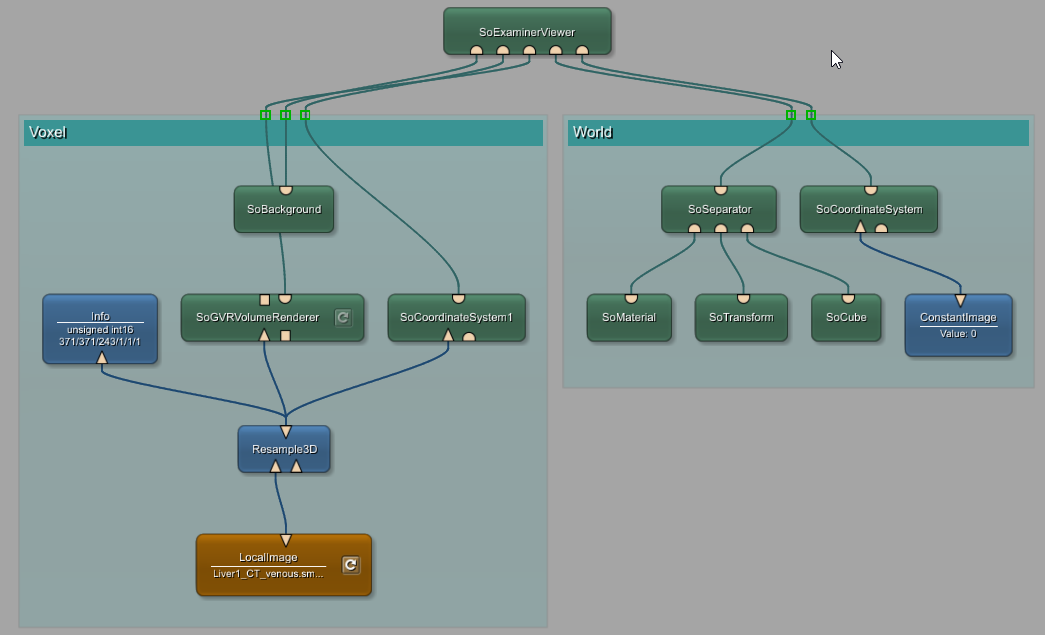
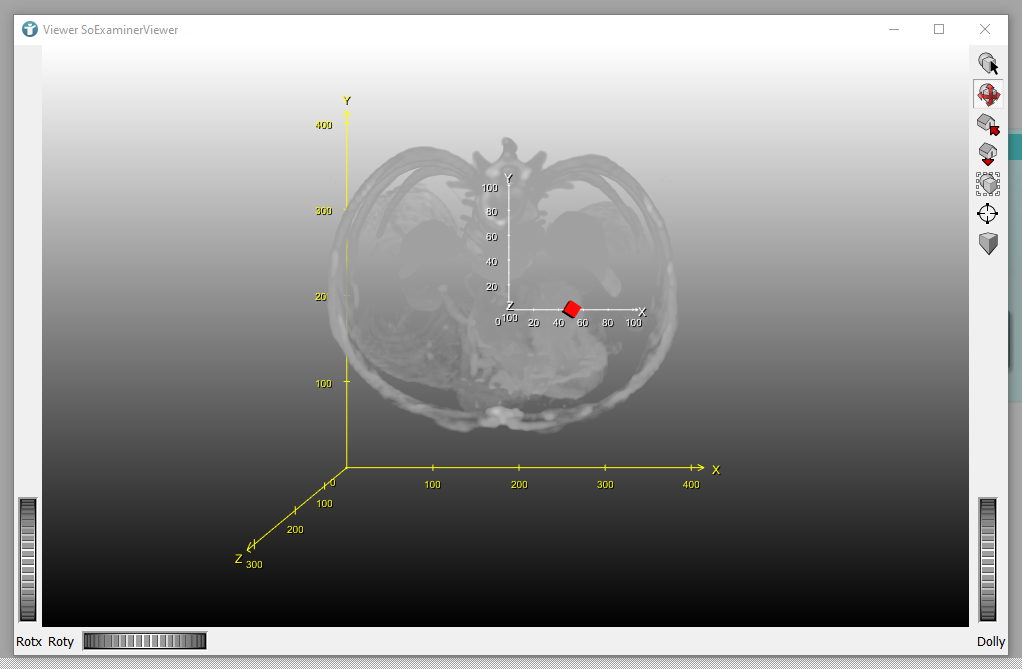
Opening the SoExaminerViewer shows the world coordinate system in white and the voxel coordinate system in yellow.
On the yellow axis, we can see that the coordinate systems are located as already seen in the Info module Advanced tab. On the x-axis, the voxel coordinate origin is translated by -186.993 and on the y-axis by -173.993.
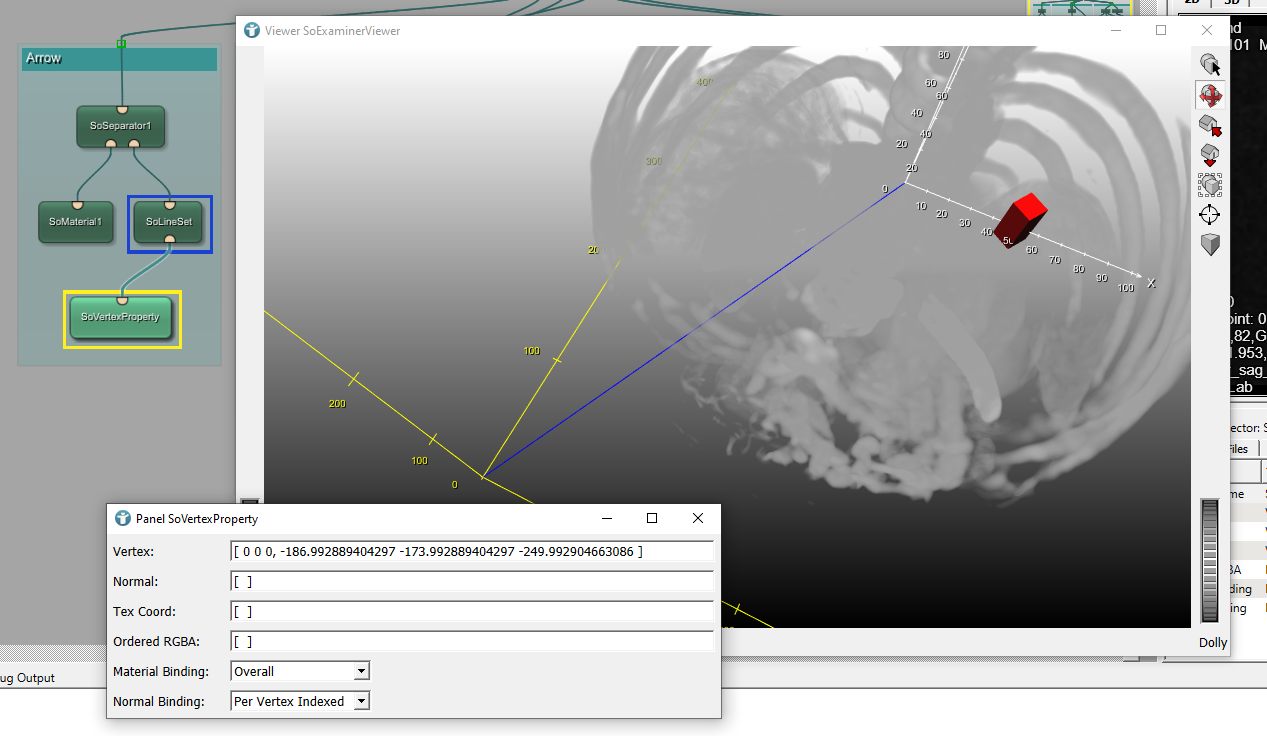
You can also add a SoVertexProperty and a SoLineSet module and configure a line from the origin of the world coordinate system 0, 0, 0 to the origin of the voxel coordinate system as defined by the image -186.993, -173.993, -249.993.
Device coordinates
Device coordinates are:
- 2D coordinates in OpenGL viewport
- Measured in pixel
- Have their origin (0,0) in the top left corner of the device (with x-coordinates increasing to the right and y-coordinates increasing downwards)
The viewport is the rectangle in pixels on your screen you want to render to. Affine transformations map abstract coordinates from your scene to physical pixels on your device.
All triangular vertices go through a projection matrix and end in a normalized range from -1 to 1 representing your field of view. To find which pixels the triangles actually cover on screen, those coordinates get linearly remapped from [−1, 1] to the range of the viewport rectangle in pixels. Technically that kind of mapping is called an affine transformation.


